![]()
Sponsored By
ROCK
HARDWARE
Chockstone Photography
Australian Landscape Prints |
 Chockstone Forum - General Discussion
General Climbing Discussion
| Author |
|
|||||
3:30:09 PM |
I am off too . I have all these lovely vouchers for professional advice re drought management in multiples of $1100 including gst . How about tony or rjames put together a good paper proving that it isn't global warming but just actually a drought . I can probable rustle up another 20 or more grants as well . Exceptional Circumstances funding is under attack by global warming . these currently give up to $500,000 in interest subsidies per enterprise as well as income support . I like many others in this area haven't accessed any of these fund but I know people who are about to exceed their $500000 limit . The government also has an interest in trying to cut these payments . 3 weeks ago 3 out of 6 computer models were predicting El Nino today all six are . most models do predict global warming and fewer and fewer models don't support this though people continue to find supposed weakness in these models. we are currently entering our thirteenth year of drought and the seasons appear to be getting drier .this will affect the whole of the food producing areas in this state . I heard today of a 1000 cow dairy deciding on friday and closing up today (8 jobs gone ). I am afraid that tonys small sections of graphs rather than the whole graph doesnt relate to the reality of what is occuring . At least I have one new experience tomorrow as I arrive in L A 1/2 an hour before i leave |
|||||
4:50:07 PM |
Lacto, just for interest I had a look at the rainfall in Victoria for the past 109 years. There doesn't seem to be any changing pattern. It's been relatively dry for the past few years, but I see that's not unusual. However, for normal patterns to continue, you could expect some very rainy years coming up. Good luck. | |||||
9:18:07 PM |
swore i wouldnt post again but Victoria where ????canada , africa certainly not australia . Nothing abnormal in the rainfall? try looking at dam levels desal plants water restrictions . Murray Darling Basin have stated that inflow last year were 50 % lower than the previous minimum and this year the same ! certainly the driest 13 years since records kept by a long way . Maybe weeoparinah has had normal rainfall therefore everywhere else has . the bore at arapiles will start to flow again as well i suppose? looks a bit like saying no climate change because of 2 little bits of a big graph. think tony and rjames should just stop feeding the chooks . |
|||||
9:59:21 AM |
On 6/07/2009 anthonyk wrote: >there's some relevant parts to that topic, but the problem is the conclusions >are far too exaggerated. The important point to remember is that climate is not controlled by a single factor. Solar cosmic rays are clearly a major influence on cloud formation and hence temperatures. They are not even considered by the IPCC. "The graph below shows a correlation between the cosmic ray counts and the global troposphere temperature radiosonde data. The cosmic ray scale is inverted to correspond to increasing temperatures. High solar activity corresponds to low cosmic ray counts, reduced low cloud cover, and higher temperatures. The upper panel shows the troposphere temperatures in blue and the cosmic ray count in red. The lower panel shows the match achieved by removing El Nino, the North Atlantic Oscillation, volcanic aerosols and a linear trend of 0.14 Celsius/decade. " 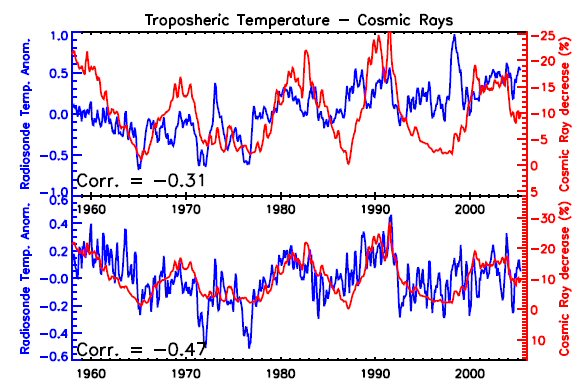 There is a far better correlation of temperatures with solar activity than CO2: 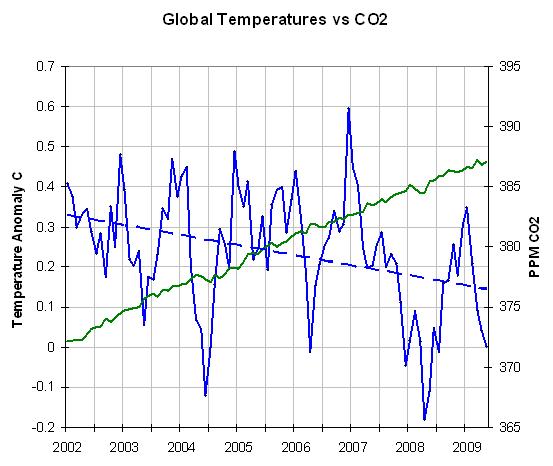 Here's another article worth reading: http://scienceandpublicpolicy.org/images/stories/papers/originals/no_evidence.pdf |
|||||
10:14:03 AM |
On 6/07/2009 lacto wrote: > Nothing abnormal in the rainfall? try looking at dam levels Yes, dear alarmist. Nothing abnormal ... except for increasing demand on water because of increasing populations. Here's some data: http://www.warwickhughes.com/sydwater/cataract.gif http://www.warwickhughes.com/sydwater/nswrain04.gif It makes me wonder how alarmists manage to do any climbing with such high levels of irrational fear ? |
|||||
11:13:09 AM |
On 7/07/2009 TonyB wrote: >On 6/07/2009 lacto wrote: >> Nothing abnormal in the rainfall? try looking at dam levels > >Yes, dear alarmist. Nothing abnormal ... except for increasing demand >on water because of increasing populations. Here's some data: >http://www.warwickhughes.com/sydwater/cataract.gif >http://www.warwickhughes.com/sydwater/nswrain04.gif > >It makes me wonder how alarmists manage to do any climbing with such high >levels of irrational fear ? Right. I know something about water and you've strayed into dangerously stupid territory here Tony. WTF does Cataract dam have to do with Victorian rainfall? Cataract is a piss weak little dam south of Sydney, that contributes less than 5% of Sydney's water. It is also not in Victoria. Neither is NSW in Victoria. And who is Warwick Hughes? When I was at Sydney Water, the MD Kerry gave a presentation on how rainfall patterns (which is different from total state rainfall, which is what your graph showed) have changed since Warragamba had been built. Reduced rainfall over the catchment (the trend was to more coastal rain) was one of the main drivers for the Desal plant; they needed to disconnect from the rain cycle. I can't find the paper online though, which is a shame, cos it was interesting. The upshot though, was that it wasn't necessarily blamed on Climate Change, mostly deforestation to the west. I do love Tony, the need you have to challenge every piece of information to disprove CC. "There's No drought in Victoria! That means CO2 isn't affecting the climate!". |
|||||
11:21:58 AM |
On 7/07/2009 TonyB wrote: >The important point to remember is that climate is not controlled by a >single factor. Solar cosmic rays are clearly a major influence on cloud >formation and hence temperatures. They are not even considered by the >IPCC. Tony, I can't let you willfully misrepresent stuff like this (I'd say lie, but you'll get upset again). What aren't considered by the IPCC? WTF is a solar cosmic ray? Is that different from sunlight? And why on earth are these magical cosmic rays a major influence on cloud formation? Clouds are very much considered by the IPCC, but like all scientific observation there are errors in their estimates. >"The graph below shows a correlation between the cosmic ray counts and >the global troposphere temperature radiosonde data. The cosmic ray scale >is inverted to correspond to increasing temperatures. High solar activity >corresponds to low cosmic ray counts, reduced low cloud cover, and higher >temperatures. The upper panel shows the troposphere temperatures in blue >and the cosmic ray count in red. The lower panel shows the match achieved >by removing El Nino, the North Atlantic Oscillation, volcanic aerosols >and a linear trend of 0.14 Celsius/decade. " Who are you quoting here? Why are they allowed to fiddle with the numbers so drastically, and the IPCC aren't? >There is a far better correlation of temperatures with solar activity >than CO2: The trend lines on those graphs are appalling. Fitting a linear trend to that data is optimistic at best, disengenuous and intentional misrepresentation at worst. |
|||||
12:02:25 PM |
There's something that's been bothering me about all these graphs... It's my understanding that it takes some time for anything released into the atmosphere to actually make it's way up and spread out and so on, right? With CFCs they said that the ozone hole would continue to grow for some time because even when we stopped releasing them it'd take some time for them to stop accumulating in the atmosphere/stratosphere/whatever level it was, right? So shouldn't these graphs also be allowing for that lag time? Shouldn't the temperature graph for say 2000-2010 be graphed against the CO2 from some 10 year period somewhat earlier? |
|||||
1:06:28 PM |
On 7/07/2009 evanbb wrote: >Tony, I can't let you willfully misrepresent stuff like this.... I took the bait didn't I? I feel dirty. |
|||||
1:33:18 PM |
On 7/07/2009 evanbb wrote: >I feel dirty. That's what she said. logheh2 |
|||||
3:06:26 PM |
On 6/07/2009 lacto wrote: Victoria where ????canada , africa certainly >not australia . Nothing abnormal in the rainfall? try looking at dam levels >desal plants water restrictions . Murray Darling Basin have stated that >inflow last year were 50 % lower than the previous minimum and this year >the same ! certainly the driest 13 years since records kept by a long way Perhaps you can explain why the Australian Bureau of Meteorology shows no significant change in rainfall patterns over the past 109 years. We have dry and wet periods Certainly Victorian rainfall has been low for the last few years, but it's also happened in the past (eg 1940). Note that when they fit a linear trend, it looks dead flat - no change. For patterns to continue, we should see heavy rainfall in the next couple of years. http://www.bom.gov.au/cgi-bin/climate/change/timeseries.cgi?graph=rain&area=vic&season=0112&ave_yr=-1 What certainly has changed is population size. |
|||||
4:32:55 PM |
This is the map of changes in rainfall in Australia since 1900. Make up your mind what is 'significant' and what isn't. 50 mm reduction for Central Vic in itself might not seem too bad but when you consider this is about 10% of the current average rainfall for some of these areas, I tend to think that it is significant. Worst for most of Australia is that reductions are occuring in winter, rainfall that traditionally recharged soil profiles when evapotranspiration is low. In the middle of a drought, 50 mm can be the difference between harvesting your wheat and making money, or feeding it stock to keep them alive......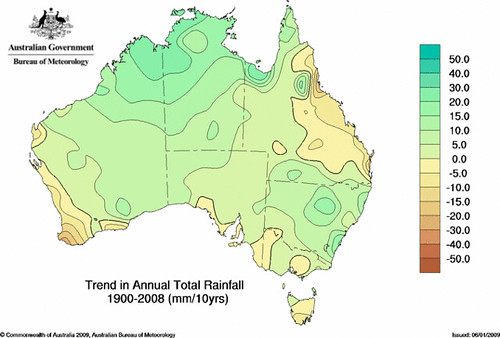 Mind you, if we get decent rainfall over the next few years this trend could reverse. Seeing as models are hinting towards both a La Nina and a positive Indian Ocean Dipole for later this year means it is unlikely this will be the year we get the rainfall we need to correct the reduction. We will see though. Also consider the 5 year and 11 year rolling trends in the data form your link R James. When you plot these there is not such a prolonged period of dry in Victoria since 1900. |
|||||
9:39:39 AM |
GLOBAL COOLING There's still a deafening silence on the most basic question, that I've asked several times: Where is the alarming warming ? The past 7, 11, 30 60 years ? Where is it ? This article by mathematician Luboš Motls shows why the alarmists find it so hard to actually find any "alarming" warming: http://wattsupwiththat.com/2009/07/07/uah-global-temperature-anomaly-hitting-the-slopes/ There's ample evidence that the world is now COOLING, not warming: "Glaciers (230 of them) are growing in the Western Himalayas. Glaciers are growing in Norway. Recently, all 50 glaciers in New Zealand were growing. Glaciers in Greenland are growing thicker. And contrary to what we've being told, the Antarctic Ice Sheet is growing, not shrinking. More than 90 percent of the world's glaciers are growing, but all that we hear about are the ones that are shrinking. Not only are glaciers growing around the world, temperatures are dropping precipitously. According to the National Oceanic and Atmospheric Administration (NOAA), some 538 low temperature records were set in June alone. Satellite data for June shows that the earth has cooled an astounding .74°F since Al Gore released his propaganda piece in 2006. " http://www.iceagenow.com/ |
|||||
10:06:54 AM |
On 9/07/2009 TonyB wrote: >GLOBAL COOLING > POST EDIT I'd written a long ranting response to Tony's nonsense, but on reflection I've deleted it. I'd been working on the theory that if I allowed the 'culture jamming' tactic to work (where the sceptics just keep trotting out the same nonsense over and over again, without listening to arguments, and without providing references) then some people would eventually believe it, because it appears so often. But, is anyone listening to him any more? Tony and RJames (who I'm not convinced are separate people) are the only people who have really taken the sceptics side, so I guess no one else cares. I've tried to be open minded, cross checked their sources, and really, I don't think they've got anything interesting to add at all. All the arguments have been roundly refuted by lots of smart people, and most of the developed and developing world have started moving anyway. Does anyone, apart from Tones or RJ, believe their arguments at all? If not, they can keep ranting. In space, no-one can hear you scream. |
|||||
11:29:48 AM |
Nope. |
|||||
11:47:22 AM |
On 7/07/2009 ajfclark wrote: >There's something that's been bothering me about all these graphs... > >It's my understanding that it takes some time for anything released into >the atmosphere to actually make it's way up and spread out and so on, right? > With CFCs they said that the ozone hole would continue to grow for some >time because even when we stopped releasing them it'd take some time for >them to stop accumulating in the atmosphere/stratosphere/whatever level >it was, right? > >So shouldn't these graphs also be allowing for that lag time? Shouldn't >the temperature graph for say 2000-2010 be graphed against the CO2 >from some 10 year period somewhat earlier? To be honest, I just don't know. But I'll speculate wildly if you think it'll help? Ozone depletion and warming are really 2 quite different mechanisms. The ozone hole gets depleted by CFCs breaking the fancy Ozone bond and making it just normal, garden variety O2 (I think). The lag in that finishing is not so much the time it takes to get up there, but that it takes so frigging long for natural processes to destroy the (primarily) CFCs that are doing the damage. The AGW mechanism is different. Sun comes in as UV (short wavelength) energy mostly. Some bounces off the atmosphere, some bounces off clouds (and I think it bounces off clouds as apposed to water vapour, because clouds consist of liquid water droplets), some bounces off the earth it self. CO2 doesn't interract with these short wavelength photons. However, once it bounces off the earth, it doesn't so much bounce, as get absorbed, then re-emitted at a different wavelength. This longer wavelength does interract with CO2, and stores energy, which contributes to stored heat. So, CO2 should start having an affect as soon as it's emitted, rather than a lagging one. Any molecule between the ground and the top of the atmosphere has the potential to trap heat. Here's a pretty good description of this: http://ipcc-wg1.ucar.edu/wg1/FAQ/wg1_faq-1.3.html |
|||||
12:11:58 PM |
Speaking of action, this is pretty big news: http://www.abc.net.au/news/stories/2009/07/09/2621128.htm "G8 leaders meeting in Italy have agreed to support a goal of an 80 per cent cut in developed countries' greenhouse emissions, and 50 per cent for developing countries, by 2050." |
|||||
12:36:26 PM |
On 9/07/2009 evanbb wrote: >Speaking of action, this is pretty big news: >http://www.abc.net.au/news/stories/2009/07/09/2621128.htm > >"G8 leaders meeting in Italy have agreed to support a goal of an 80 per >cent cut in developed countries' greenhouse emissions, and 50 per cent >for developing countries, by 2050." > Call me a cynic, but when a politician says “support a goal” I don’t read decisive action. Hope I’m wrong |
|||||
12:36:48 PM |
It is big news, as is the Waxman Markely bill, and the CPRS targets, and the WBCSD report, it really would appear that most of the world has moved past this argument and are looking at mitigation & adaptation. But Tony... this give you the oppourtunity to refine your arguments so that in 40 years you can claim you were right, or admit that you were foolish and wrong, either way work. LD |
|||||
1:09:36 PM |
On 9/07/2009 evanbb wrote: >Does anyone, apart from Tones or RJ, believe their arguments at all? If >not, they can keep ranting. > I would guess that Tones and RJ would be pretty much out there on their own as far as the Chockstone community goes. However, the BS they peddle does sway some people. So the better the arguments that are made to refute this BS and the fewer converts they get to the do nothing cause, the better off all of will be in the long run. Including Tones and RJ. |
| There are 818 messages in this topic. |
Home | Guide | Gallery | Tech Tips | Articles | Reviews | Dictionary | Forum | Links | About | Search
Chockstone Photography | Landscape Photography Australia | Australian Landscape Photography | Landscape Photos Australia
Please read the full disclaimer before using any information contained on these pages.
Australian Panoramic |
Australian Coast |
Australian Mountains |
Australian Countryside |
Australian Waterfalls |
Australian Lakes |
Australian Cities |
Australian Macro |
Australian Wildlife
Landscape Photo |
Landscape Photography |
Landscape Photography Australia |
Fine Art Photography |
Wilderness Photography |
Nature Photo |
Australian Landscape Photo |
Stock Photography Australia |
Landscape Photos |
Panoramic Photos |
Panoramic Photography Australia |
Australian Landscape Photography |
High Country Mountain Huts |
Mothers Day Gifts |
Gifts for Mothers Day |
Mothers Day Gift Ideas |
Ideas for Mothers Day |
Wedding Gift Ideas |
Christmas Gift Ideas |
Fathers Day Gifts |
Gifts for Fathers Day |
Fathers Day Gift Ideas |
Ideas for Fathers Day |
Landscape Prints |
Landscape Poster |
Limited Edition Prints |
Panoramic Photo |
Buy Posters |
Poster Prints